Most operators of large physical portfolios manage their single biggest controllable cost, maintenance, in spreadsheets. Work orders live in the facilities team's files. Asset registers live in finance. Vendor invoices live in email. None of it joins. So nobody can answer the question that decides eight figures of P&L: which assets cost us the most, and should we keep fixing them or replace them. In one real estate and mall engagement, annual maintenance ran over IDR 5B with no consolidated view across properties.
The fix is not another dashboard on top of the spreadsheets. It is to treat maintenance and asset data as a data product: a single, versioned, queryable source that the facilities, finance, and asset-management teams all read from. Below is how we build it and the one decision rule that turns it into money.
The cost is not the spreadsheet. It is the questions the spreadsheet makes unaskable.
Why spreadsheets hide the money
A spreadsheet has no entity model. The same chiller is "CH-02", "Chiller 2", and "AHU basement" across three files, so its true lifetime cost is never summed. There is no event history, so you cannot see that a pump has been repaired four times in eighteen months. And there is no join to asset value or age, so repair-versus-replace is a gut call made by whoever owns the budget that quarter. The cost is not the spreadsheet. It is the questions the spreadsheet makes unaskable.
The lakehouse: one model, many readers
We land the raw sources, work orders, asset registers, vendor invoices, meter and sensor reads, into a lakehouse and model them around two grains: an asset dimension keyed to a stable asset ID, and a maintenance-event fact table where every repair, inspection, and invoice is one immutable row. In the real estate engagement this ran on AWS: Glue for ingestion and cataloging, Redshift as the warehouse and serving layer for the cost and asset marts. The hard part is not the warehouse. It is asset-ID resolution, the entity-matching that collapses "CH-02" and "Chiller 2" into one asset. Get that right and analysis cycles that took weeks collapse to days.
- Asset dimension: stable ID, type, location, install date, replacement cost, expected useful life.
- Maintenance-event fact: one immutable row per repair, inspection, or invoice, keyed to asset ID and timestamped.
- Cost and asset marts in Redshift: lifetime cost per asset, cost per asset type, cost trend over time.
Three analytics that pay for the build
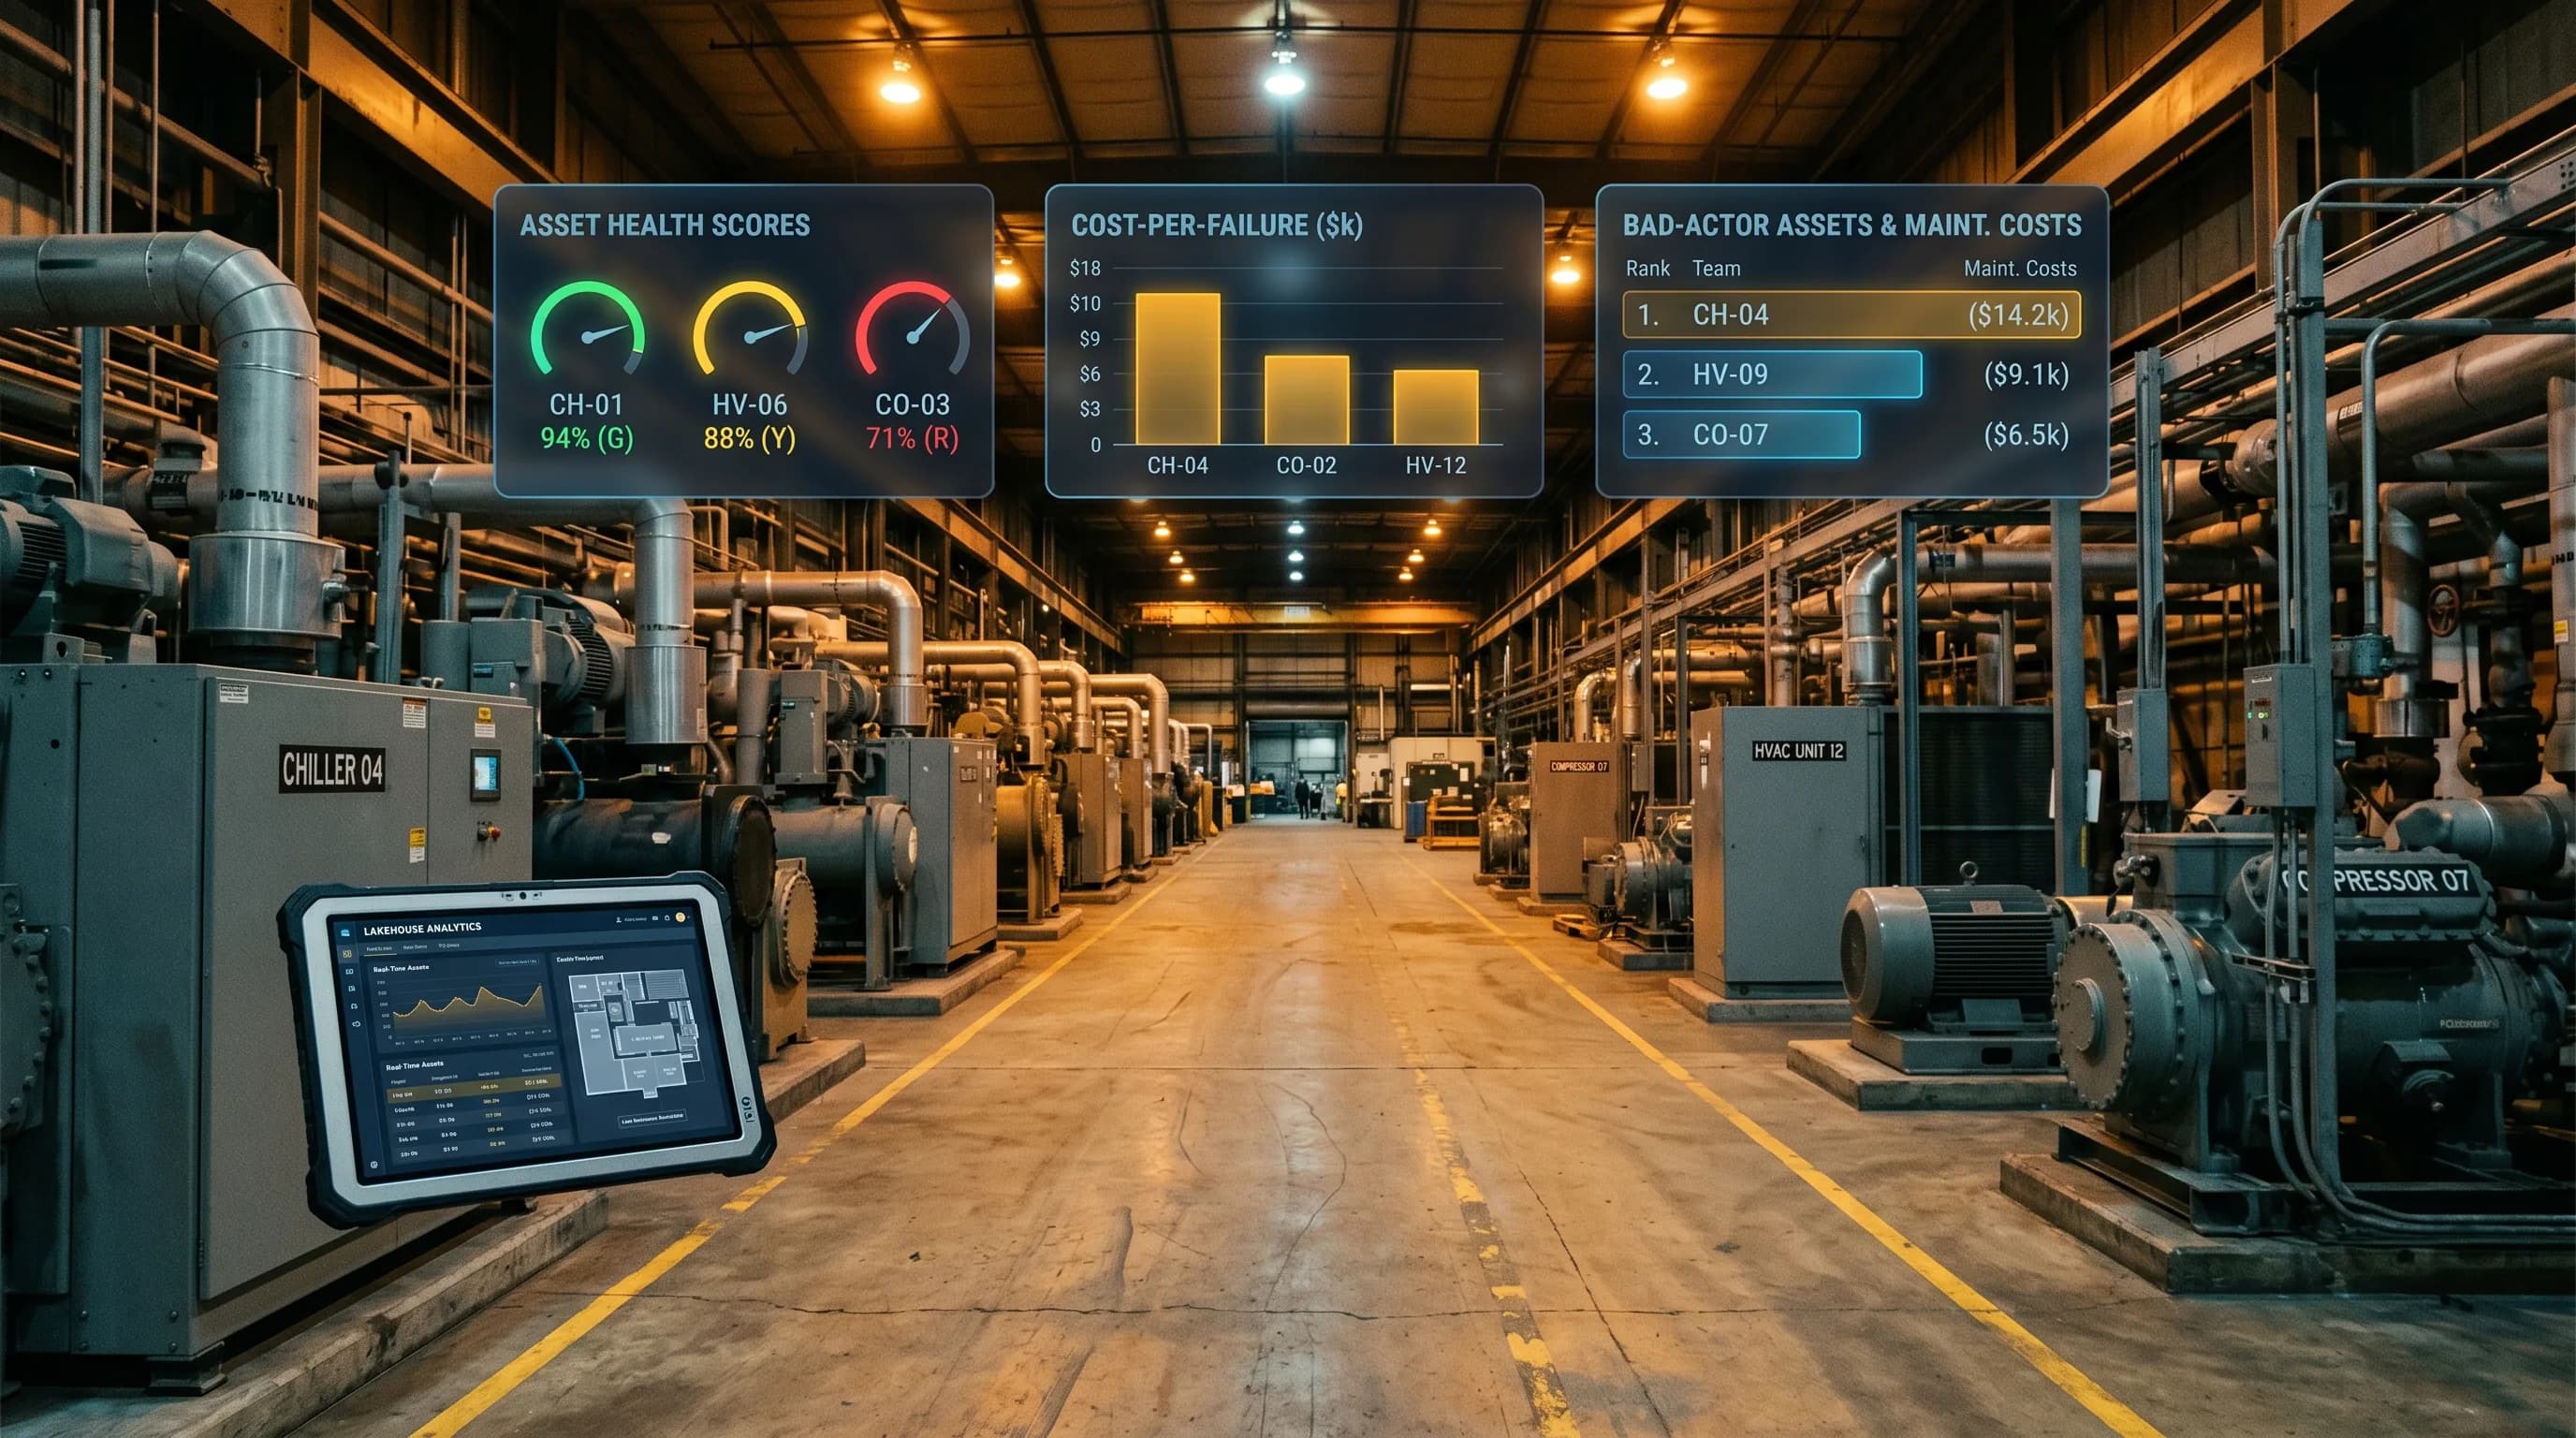
Once the model exists, three views do the work. Asset performance ranks every asset by total lifetime maintenance cost and event frequency, surfacing the small set of bad actors that drive most of the spend. Cost-driver analysis attributes spend across asset type, vendor, property, and failure mode, which is usually where a single vendor or one equipment class quietly dominates the bill. And repair-versus-replace becomes arithmetic instead of opinion.
The one decision rule
For each asset, compare trailing twelve-month repair spend against the annualised cost of replacement (replacement cost divided by remaining useful life). When trailing repair cost crosses roughly 60 to 70% of annualised replacement cost and event frequency is rising, the asset is a replace candidate. That single rule, applied across a portfolio, reclassifies a long tail of "just keep fixing it" assets that are individually small and collectively enormous. Tune the threshold to your cost of capital and downtime risk, but the structure holds. The one override is criticality: a life-safety or compliance-critical asset gets replaced on condition and regulation, not on the spreadsheet, and the model should flag those separately rather than rank them.
Implementation notes
- Solve asset-ID resolution first; it is the load-bearing wall, and deterministic matching on location plus type plus fuzzy name beats any model you add later.
- Make the event fact immutable and append-only so cost history is auditable and never overwritten by a corrected invoice.
- Compute useful life and replacement cost as explicit columns on the asset dimension, not as buried spreadsheet formulas, so the decision rule is reproducible.
- Ship the cost and repair-versus-replace marts before any predictive work; the descriptive view already pays for the project.
- Put finance and facilities in front of the same marts from day one: adoption dies when each team keeps a private copy, and the whole point is one set of numbers both will defend in the same meeting.
This is also the foundation for predictive maintenance
The same clean event history and asset model is exactly what a failure-prediction model needs as training data. We have shipped that next step elsewhere: in HVAC, ML fault detection at 93% true positive and roughly 7% false positive, plus remaining-useful-life and load-forecasting, drove 15 to 20% energy savings. You cannot get there from spreadsheets, because the model needs labelled failure history joined to asset identity. Build the data product first, and predictive maintenance becomes a model on top of an asset, not a year-long data project disguised as ML.
The business value
Consolidating maintenance and asset data into a queryable product does three things a spreadsheet cannot: it turns a weeks-long, error-prone analysis cycle into a days-long one, it makes repair-versus-replace a defensible number instead of a budget-season argument, and it lays the foundation for predictive maintenance without a second migration. On a portfolio spending eight figures a year, reclassifying even a fraction of the long-tail bad-actor assets returns the build cost many times over. The spreadsheets are not just inefficient. They are where the money is hiding.


